Jaipur's air today: where the smoke is coming from
Jaipur's smoke report
Right now the wind over Jaipur blows from the north-east at 9 km/h (weather model, 30 October, 08:15 IST). None of the 28 fires seen within 250 km in the 24 hours to 30 October, 04:18 IST lie upwind, so the wind is not carrying their smoke here right now.
Ranks among the cities with pages here that have any of each: #1 has the most.
Map of the fires around the city, last 24 hours
Each dot is one fire a NASA satellite saw. Red dots are upwind, in the direction the wind is coming from, so their smoke is the likeliest to be reaching the city now; grey dots are in other directions. The moving lines show the wind blowing towards the city. Tap a dot for the village and the time.
Fires within 250 km in the last 24 hours, by direction. Red: the side the wind is coming from (the north-east). Tap a direction to pick out its fires on the map.
What satellites see around Jaipur
What satellites and surveys see around the city. Each is a different measure, so they can't be added up into shares of the air.
Fires around Jaipur in the last 30 days
The busiest of the last 29 days was 28 October, with 274 fire spots within 250 km, 1 of them within 50 km.
within 250 km within 50 km
A fire spot is one fire seen on a day, however many satellites saw it (Pakistan-time days). The archive runs every day from 1 October 2026; before that it holds only the October-November seasons.
NO₂ pollution in Jaipur: traffic, industry and power plants
Over the last 14 days the air over Jaipur held 1.62 times the region's usual level of nitrogen dioxide (NO₂), #35 of 58 cities.
The strongest NO₂ peak within 35 km was 2.14 times the usual level, 13 km from the city centre in the built-up area of Jaipur, the pattern of traffic.
From Sentinel-5P's TROPOMI instrument via NASA's GIBS tiles, which publish NO₂ as colour bands: a level here is good to about one band. NO₂ in big cities comes mostly from vehicle engines; peaks are named after what is nearby, which suggests a source but doesn't measure one. NO₂ window 15 October to 28 October 2026.
Brick kilns
238 brick kilns stand within 50 km of Jaipur.
Landfills
Satellites and aircraft have measured methane rising from Guwardi, 14 km from the centre, 12 times, about 825 kg an hour. That puts it #17 of the 58 measured landfills in Pakistan and India.
Rank among the 58 landfill records with a measured rate in Carbon Mapper's data for Pakistan and India (this extract covers only these two countries). Rates are Carbon Mapper's automatic per-plume estimates; landfill methane also carries the smell and smoke of burning rubbish.
Power plants and industry
No fossil-fuel power plant is mapped within 50 km of Jaipur, but 53 industrial areas are.
Within 50 km of the city centre, on either side of the border. These are lists of what is there, not measures of how much each adds to the air.
Every mapped source within 50 km of Jaipur
Tap a layer to hide it, or a site for its name.
Brick-kiln surveys, OpenStreetMap, Carbon Mapper and NASA FIRMS, on either side of the border. These map what is there, not how much each adds to the air. /sites/ · Site lists built 26 October 2026.
Fires around Jaipur this season compared with past years
Fire spots within 250 km of Jaipur from 1 October to 29 October, each year. These count Suomi NPP alone, so every year is measured by the same instrument and the years compare fairly (the 30-day chart above counts all five satellites, three VIIRS and two MODIS, so its numbers are higher).
* 2026: 1 day without Suomi NPP data: a floor
Jaipur against the other cities
Each strip holds the cities with pages here that have any of it, the most on the left; the red mark is Jaipur. They are different measures, so a high rank on one isn't a larger share of the air than a high rank on another.
All the rankings: city rankings
Send this to someone in Jaipur
Pasted into WhatsApp or X, the link shows this map of the fires and the wind, redrawn every few hours.
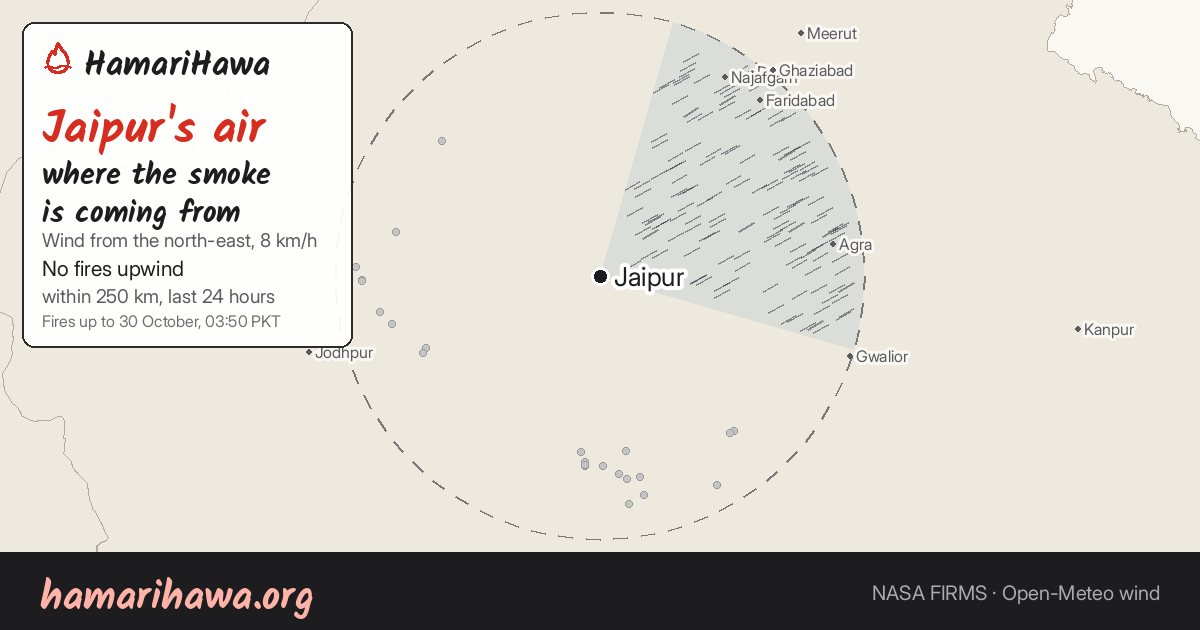
Jaipur air today: where the smoke is coming from
hamarihawa.org
All the numbers
Every table behind this page.
Fires within 250 km by direction, last 24 hours
| From the | Fires |
|---|---|
| north | 0 |
| north-east (the wind is coming from here) | 0 |
| east | 0 |
| south-east | 3 |
| south | 12 |
| south-west | 0 |
| west | 12 |
| north-west | 1 |
Fires within 250 km in the last 7 days
| District | Province or state | Country | Distance | Fires | On farmland |
|---|---|---|---|---|---|
| Bundi | Rajasthan | India | 174 km | 352 | 98% |
| Baran | Rajasthan | India | 222 km | 262 | 94% |
| Kota | Rajasthan | India | 193 km | 191 | 96% |
| Sheopur | Madhya Pradesh | India | 175 km | 142 | 95% |
| Mathura | Uttar Pradesh | India | 200 km | 98 | 95% |
| Guna | Madhya Pradesh | India | 243 km | 85 | 93% |
| Nagaur | Rajasthan | India | 206 km | 48 | 35% |
| Aligarh | Uttar Pradesh | India | 222 km | 47 | 100% |
| Sawai Madhopur | Rajasthan | India | 128 km | 40 | 95% |
| Palwal | Haryana | India | 205 km | 30 | 90% |
Fires around Jaipur this season compared with past years
| Season | Fire spots |
|---|---|
| 2019 | 693 |
| 2020 | 893 |
| 2021 | 333 |
| 2022 | 573 |
| 2023 | 1,688 |
| 2024 | 1,059 |
| 2025 | 605 |
| 2026 (so far) | 1,038 (1 day without Suomi NPP data: a floor) |
Landfill methane records
| Site | Methane | Plumes seen | Last seen | Rank |
|---|---|---|---|---|
| Guwardi (Jaipur, India, 14 km) | 825 kg/h | 12 | 13 March 2026 | 17 of 58 |
| Sewarampura (Jaipur, India, 14 km) | 481 kg/h | 9 | 21 September 2026 | 32 of 58 |
Rank among the 58 landfill records with a measured rate in Carbon Mapper's data for Pakistan and India (this extract covers only these two countries). Rates are Carbon Mapper's automatic per-plume estimates; landfill methane also carries the smell and smoke of burning rubbish.
Every measure and rank
Where Jaipur stands among the 58 cities with pages here, on each measure. They are different measures, so a high rank on one isn't a larger share of the air than a high rank on another.
| Measure | Jaipur | Rank |
|---|---|---|
| Fire spots within 250 km, last 30 days | 3,179 | 22 of 58 |
| NO₂, times the usual level (14 days) | 1.62× | 35 of 58 |
| Landfill methane within 50 km | 1,306 kg/h | 14 of 34 |
| Measured plant CO₂ within 50 km | none measured | – |
| Brick kilns within 50 km | 238 | 24 of 34 |
| Industrial areas within 50 km | 53 | 42 of 58 |
| Always-hot sites within 50 km | 0 | – |
Ranks on today's fires
Jaipur's place among the cities, on the numbers that change with each satellite pass.
- Fire spots upwind, last 24 hours: 0
- Fire spots within 250 km, last 24 hours: 39 of 57
- Fire spots within 250 km, last 7 days: 17 of 58
All the rankings: city rankings
Questions about Jaipur's air
Where is Jaipur's smoke coming from today?
Right now the wind over Jaipur blows from the north-east at 9 km/h (weather model, 30 October, 08:15 IST). None of the 28 fires seen within 250 km in the 24 hours to 30 October, 04:18 IST lie upwind, so the wind is not carrying their smoke here right now.
Are crop fires burning near Jaipur?
In the last 24 hours NASA's satellites saw 28 fire spots within 250 km of Jaipur, and 3,179 in the last 30 days. Satellites only see what is burning as they pass, and not under cloud.
How bad is traffic pollution in Jaipur?
Over the 14 days 15 October to 28 October 2026, nitrogen dioxide in the air over Jaipur (within 15 km) was about 1.62 times the usual level of the surrounding region, roughly 3.63 ×10¹⁵ molecules/cm². Of the 58 cities with enough clear days, it ranks 35.
How many brick kilns are there near Jaipur?
The satellite surveys count 238 brick kilns within 50 km of Jaipur.
Which landfills near Jaipur release methane?
Carbon Mapper has measured methane plumes from Guwardi (825 kg/h), Sewarampura (481 kg/h).
Every number on this page is also in machine-readable form (JSON).
More about Jaipur
Nearby cities: Gurugram (211 km), Agra (222 km), Delhi (235 km), Noida (240 km)
Fires up to 30 October, 04:18 IST. This page updates every 15 minutes. Upwind is a guide, not proof: smoke can travel further than 250 km, the wind turns during the day, and satellites can't see fires under cloud. A fire spot is one fire, about 375 m across, however many satellites saw it. Fires: NASA FIRMS (VIIRS and MODIS). Wind: Open-Meteo's weather model. Air: Copernicus CAMS model estimates, which read low in winter.